Journey Mapping · Field Notes
AI Customer Journey Mapping Framework: 5-Step Implementation Guide
This page is the implementation lane: use a practical 5-step process to launch your first data-driven journey map in 30 days.
Why most journey maps are expensive wall art
Companies spend months drawing detailed journey maps, present them in beautiful decks, then watch conversion stay flat. The maps are usually built on how teams think customers behave, not how customers actually behave.
This framework is for building maps that update from real data: pick one revenue-linked metric, audit the touchpoints you can measure, stand up a lean analytics stack, wire a dashboard that warns you, then run a 30-day fix sprint.
Two shapes I see constantly
SaaS B2B journeys usually break between demo request and sales handoff: too many form fields, slow follow-up, content that ignores buyer role. Ecommerce breaks between cart and purchase: surprise shipping, weak trust signals, payment friction. Same framework. Different metric.
Step 1: One metric
Write the outcome on a sticky: "Increase trial-to-paid by 15% in 90 days" or "Raise checkout completion by 10%." Everything on the map must explain movement on that number. If a workshop produces twelve priorities, you do not have a map. You have a wish list.
Step 2: Touchpoint audit
Inventory ads, landing pages, email, product events, support, and sales stages. For each: event name, owner, last verified date, known gaps. You need identity stitching good enough to follow a person across stages, not perfect omnichannel fantasy.
Step 3: Lean AI analytics stack
A practical starter: Google Analytics (or equivalent) for web, HubSpot or your CRM for CRM stages, Mixpanel or Amplitude for product, Zapier or native connectors for glue. Stay under a few hundred dollars a month until the map earns its keep. Fancy CDPs can wait.
Step 4: Dashboard that warns you
Essential views: stage conversion, time-in-stage, drop-off reasons where you have them, anomaly flags on the primary metric. Add an "anomaly explanation" note field so someone records why a spike happened. Tools that alert without narrative become noise.
Step 5: 30-day fix sprint
Week 1: confirm metric and baseline. Week 2: ship one friction fix. Week 3: measure and interview 5-10 customers who stalled. Week 4: lock the win or kill the change. Then run another sprint on the next bottleneck.
90-day shape
Days 1-30: foundation and first sprint. Days 31-60: second bottleneck and segment splits. Days 61-90: systematize the review ritual and document playbooks. Directionally, primary metrics often move 10-25% when teams stay disciplined.
AI journey mapping implementation
- How long until a first useful map?
- A living first version can land in 2-4 weeks if you scope one path. Pretty wall art takes months and still fails.
- Do I need a CDP?
- Not for v1. Analytics + CRM + product events is enough to find the first leak.
- What metric should I pick?
- The closest revenue-linked conversion on your critical path. Avoid awareness vanity until the money path is healthy.
- How is this different from the optimization guide?
- This guide launches the map. The optimization twin diagnoses behavioral patterns after the foundation exists.
- What breaks AI journey projects?
- Bad identity data, no single metric owner, and sprinting on twelve fronts. Fix those before buying more AI.
Keep Reading
Related Articles
Pick the next guide based on where you are in implementation.

AI Customer Journey Mapping Optimization: Complete Guide 2025
Learn how AI transforms customer journey mapping with advanced analytics, real-time personalization, and predictive insights.
Read article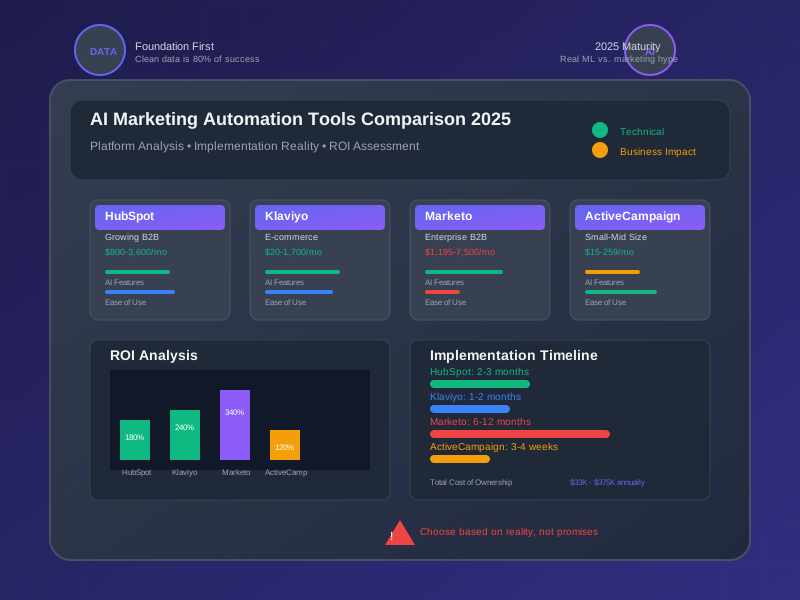
AI Marketing Automation Tools Comparison 2025
Compare the best AI marketing automation platforms and tools for optimizing customer journeys and engagement workflows.
Read article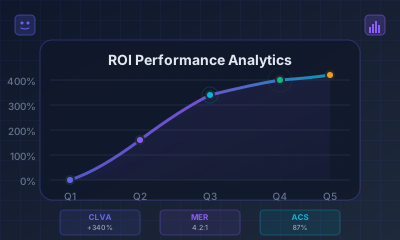
AI Marketing ROI Measurement & Analytics
Learn how to measure and optimize ROI from AI-powered marketing campaigns and customer journey initiatives.
Read articleNext step
Ready for systems that keep compounding?
Say hi, send a work brief, or dig through the Lab first. Same person on the other side. I reply personally.